Resources
Figures I have made! Click the images to see them full size. Please feel free to use with attribution (CC-BY). If you'd like to cite them, please use "Magnetic Fields Around Radio Galaxies" (E. L. Alexander, 2022, Doctoral dissertation, The University of Manchester).
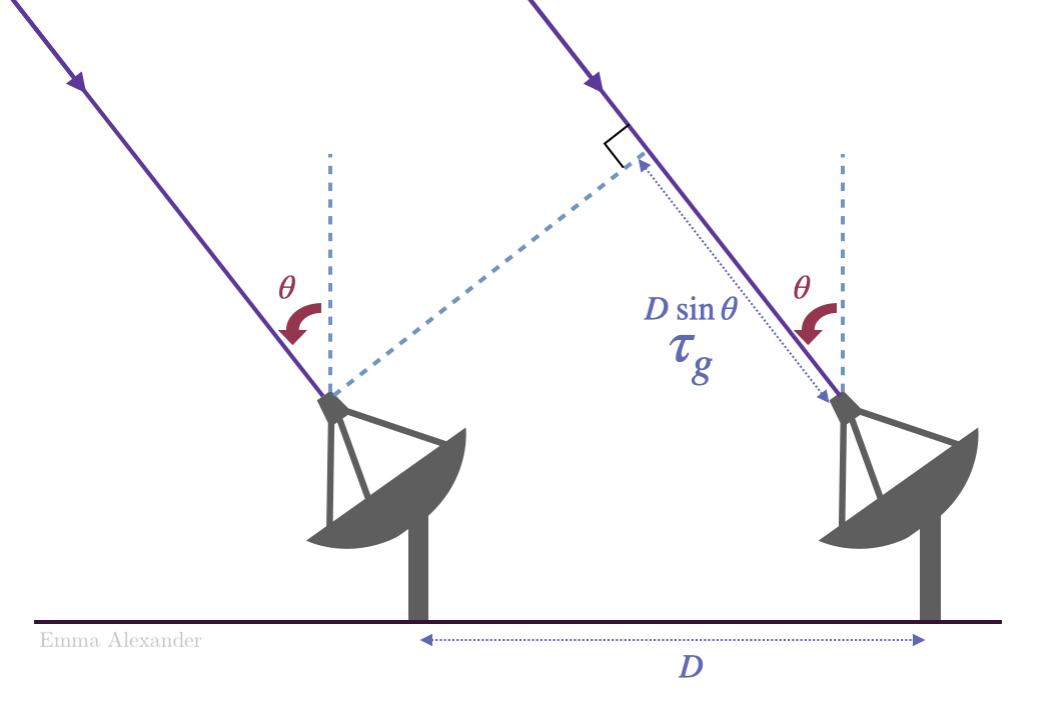
Diagram to show the basic principles of aperture synthesis interferometry. Two receiver dishes are pointed at an angle θ from the zenith towards a single far-field point source, and are a distance D apart (the baseline between them). There is a timing offset of τg, due to the light travel distance offset of D sin θ, which is used to combine the signals of the two dishes.
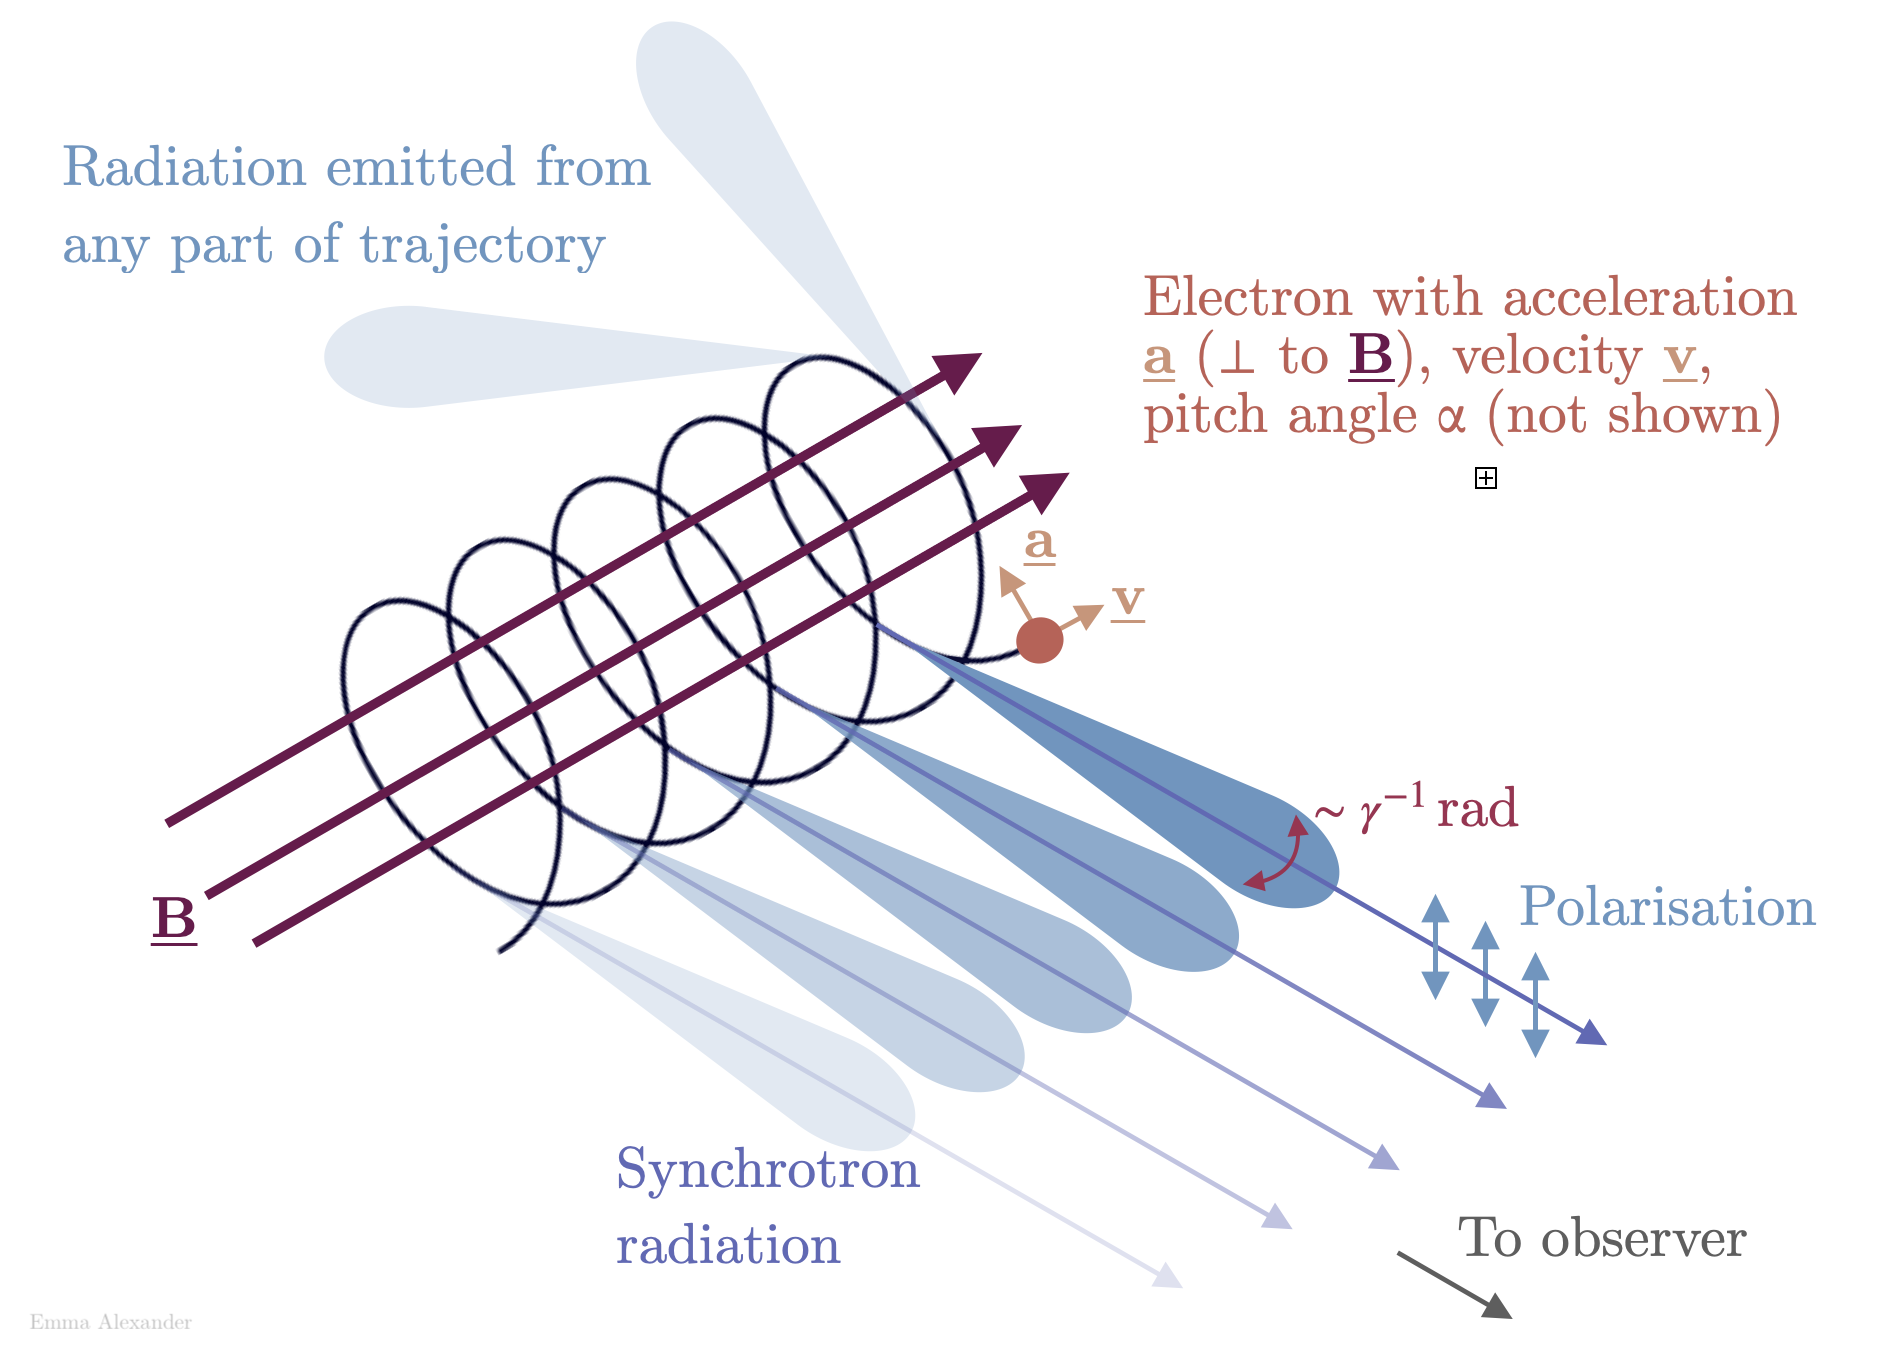
Diagram of synchrotron emission, arising from an electron moving along a helical path around an ordered magnetic field. The Lorentz force causing the acceleration a is perpendicular to the magnetic field vector B, and both are also perpendicular to the circular component of the electron’s velocity v. The radiation is concentrated in a beamwidth of ∼ 1/γ radians.
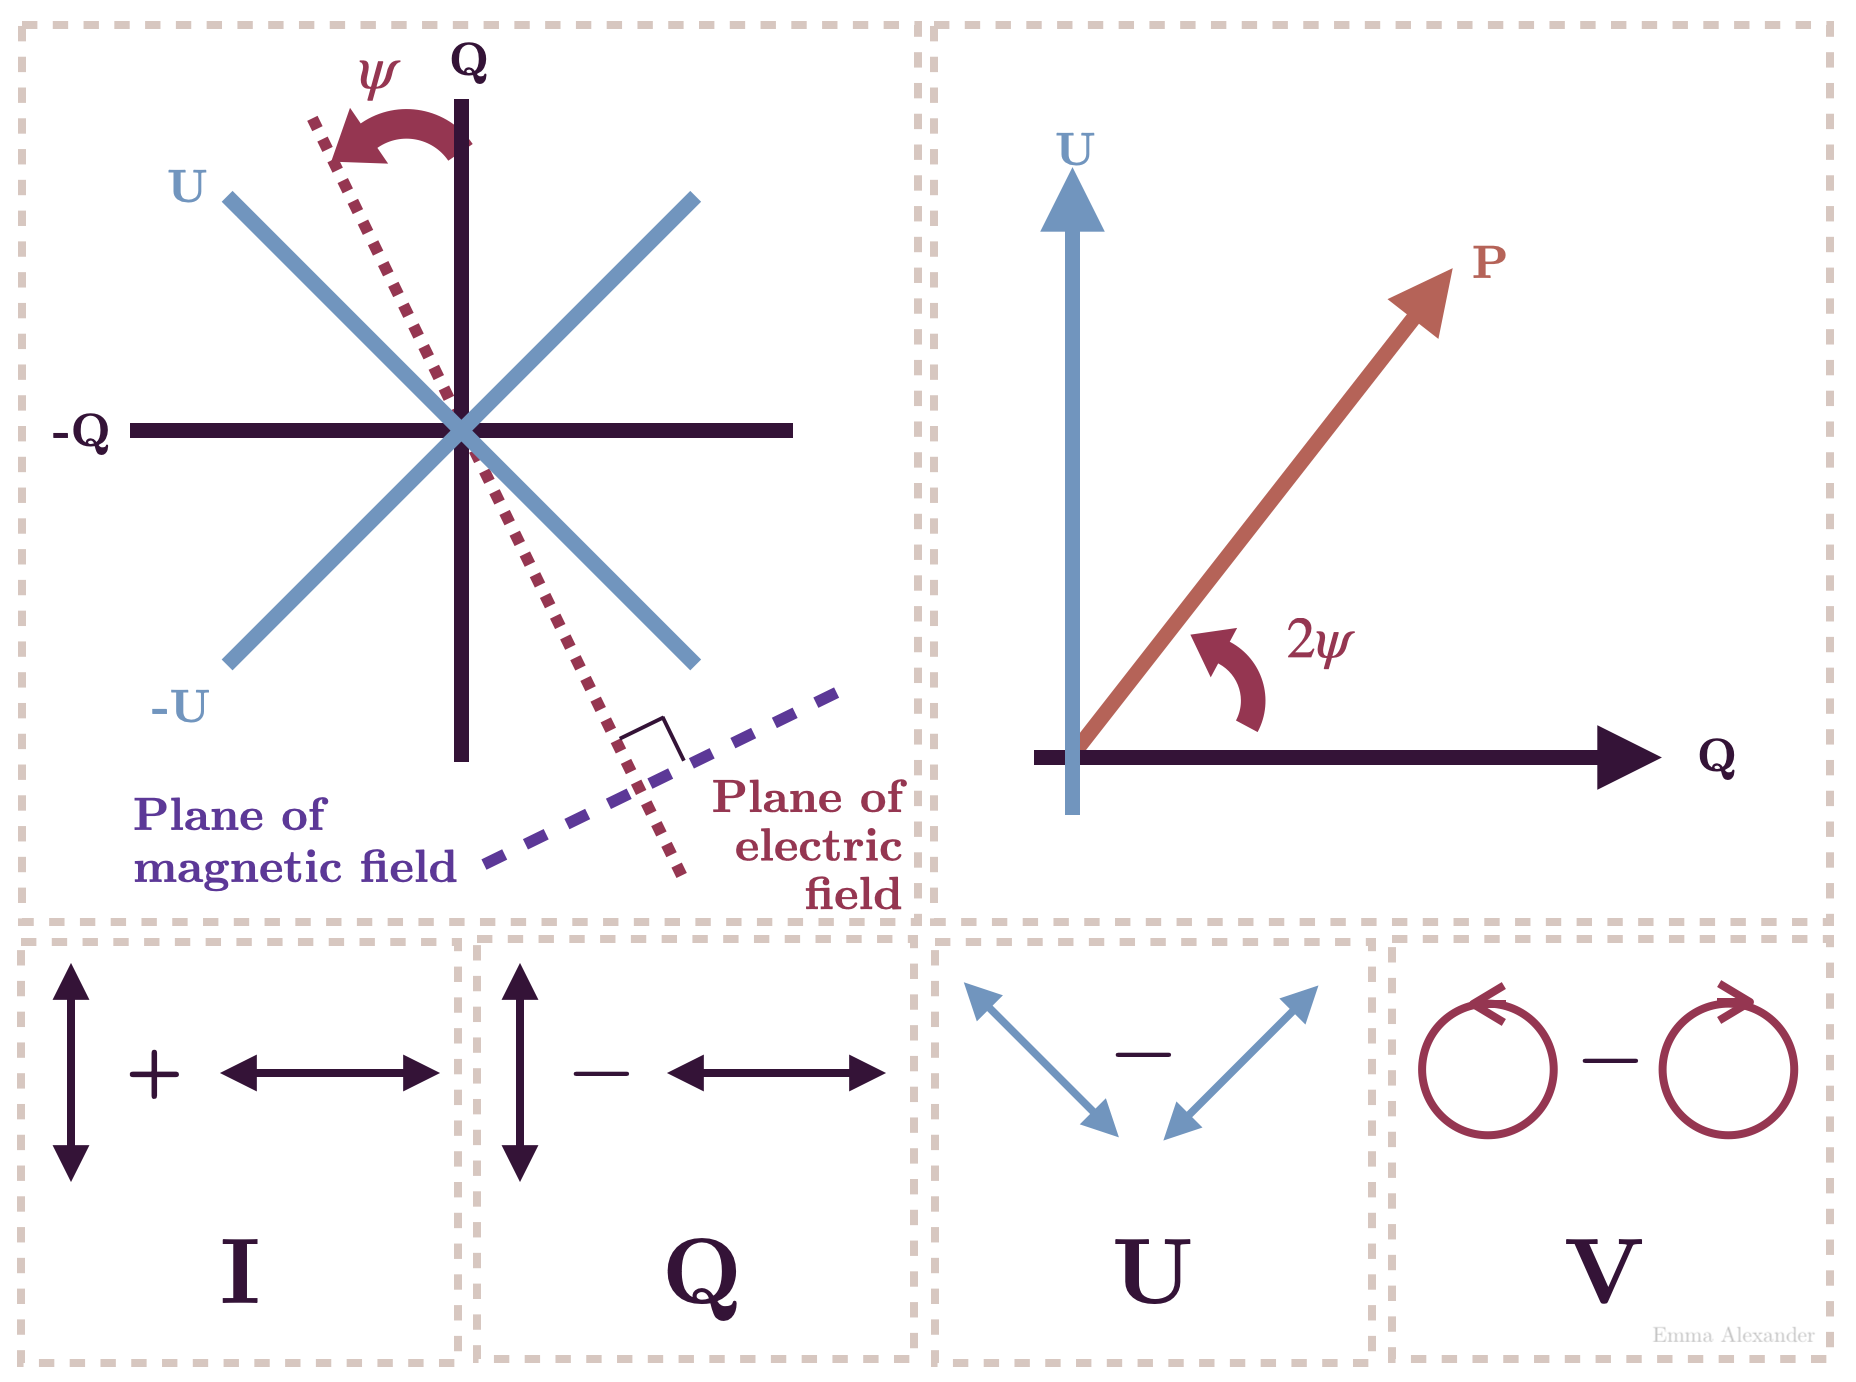
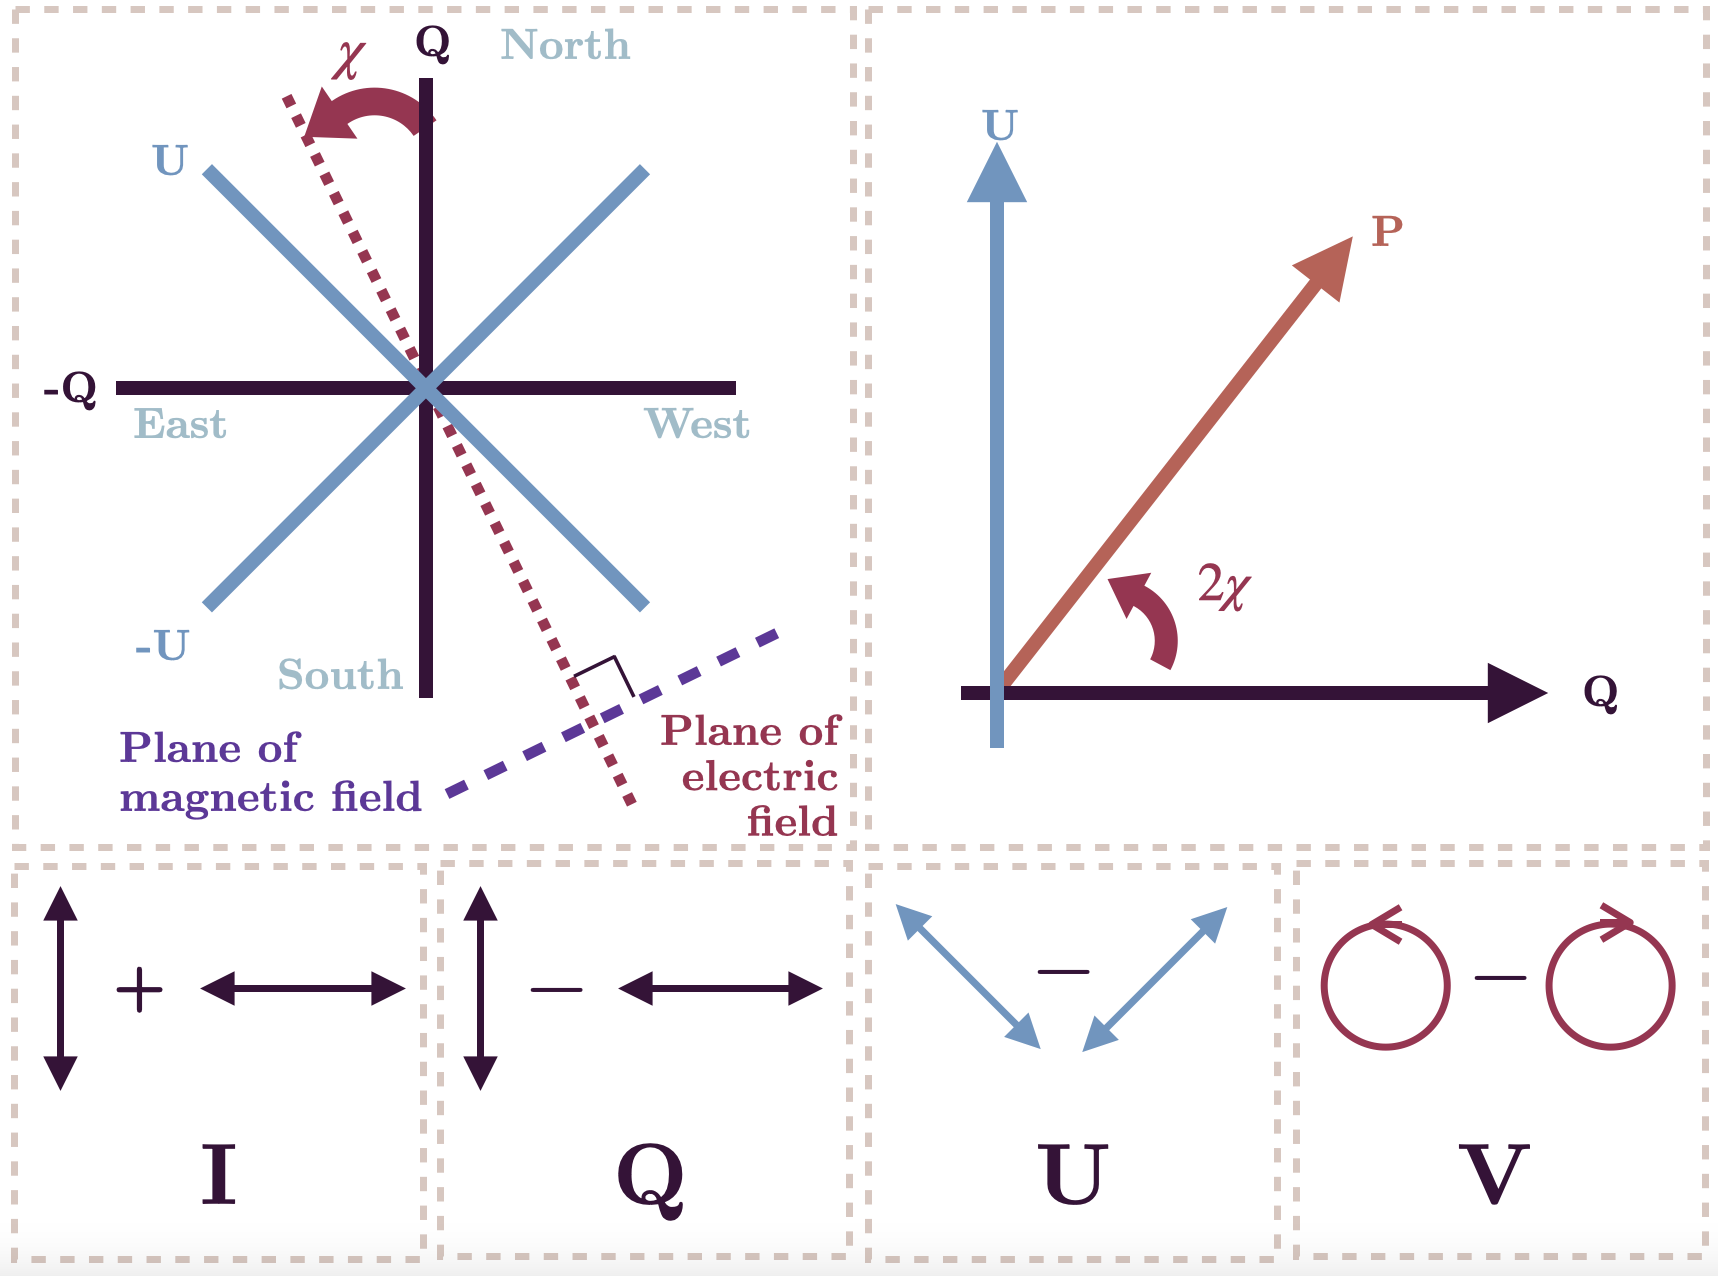
Representations of the Stokes parameters in relation to polarisation angle ψ, polarisation vector P, and the planes of the electric and magnetic fields. On the sky, the ±Q axes correspond to reversed compass directions (i.e clockwise from the top: North West South East), according to IAU convention. An alternative figure using χ instead of φ can be found here.
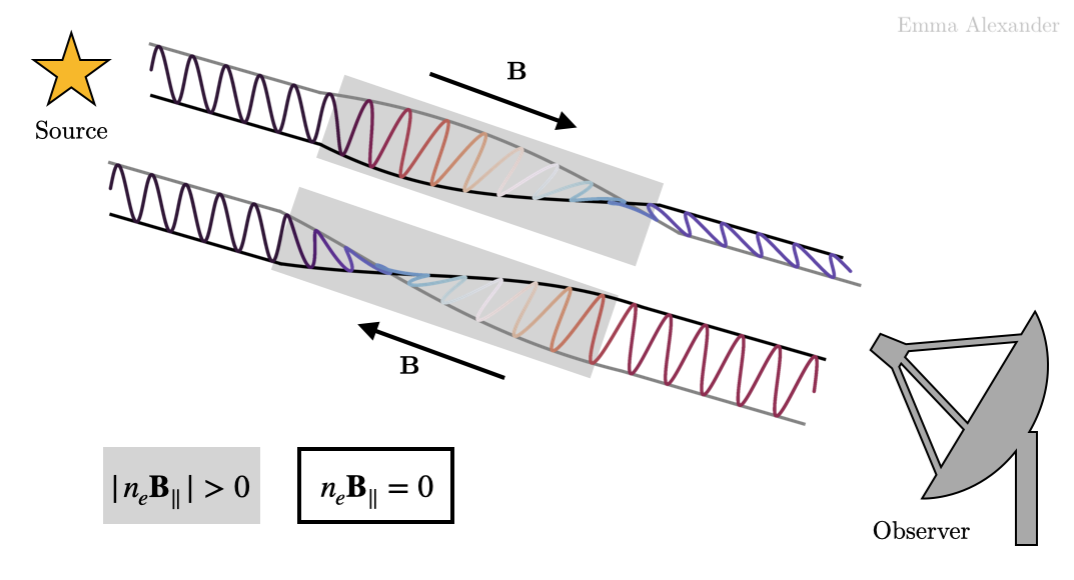
A basic representation of Faraday Rotation. Two electromagnetic waves are shown coming from an astrophysical source. They travel uninterrupted through a non- magneto-ionic region (white background, neB‖ = 0). They then reach areas with the same electron density ne and magnetic field strength B‖, but the magnetic fields are oppositely orientated. The region with B‖ pointed towards the observer rotates the plane of polarisation clockwise, and the region with B‖ pointing away rotates the angle by the same amount, but this time anti-clockwise. The code I wrote to generate the rotating wave can be found here. If used, please cite with the DOI 10.5281/zenodo.5899326.
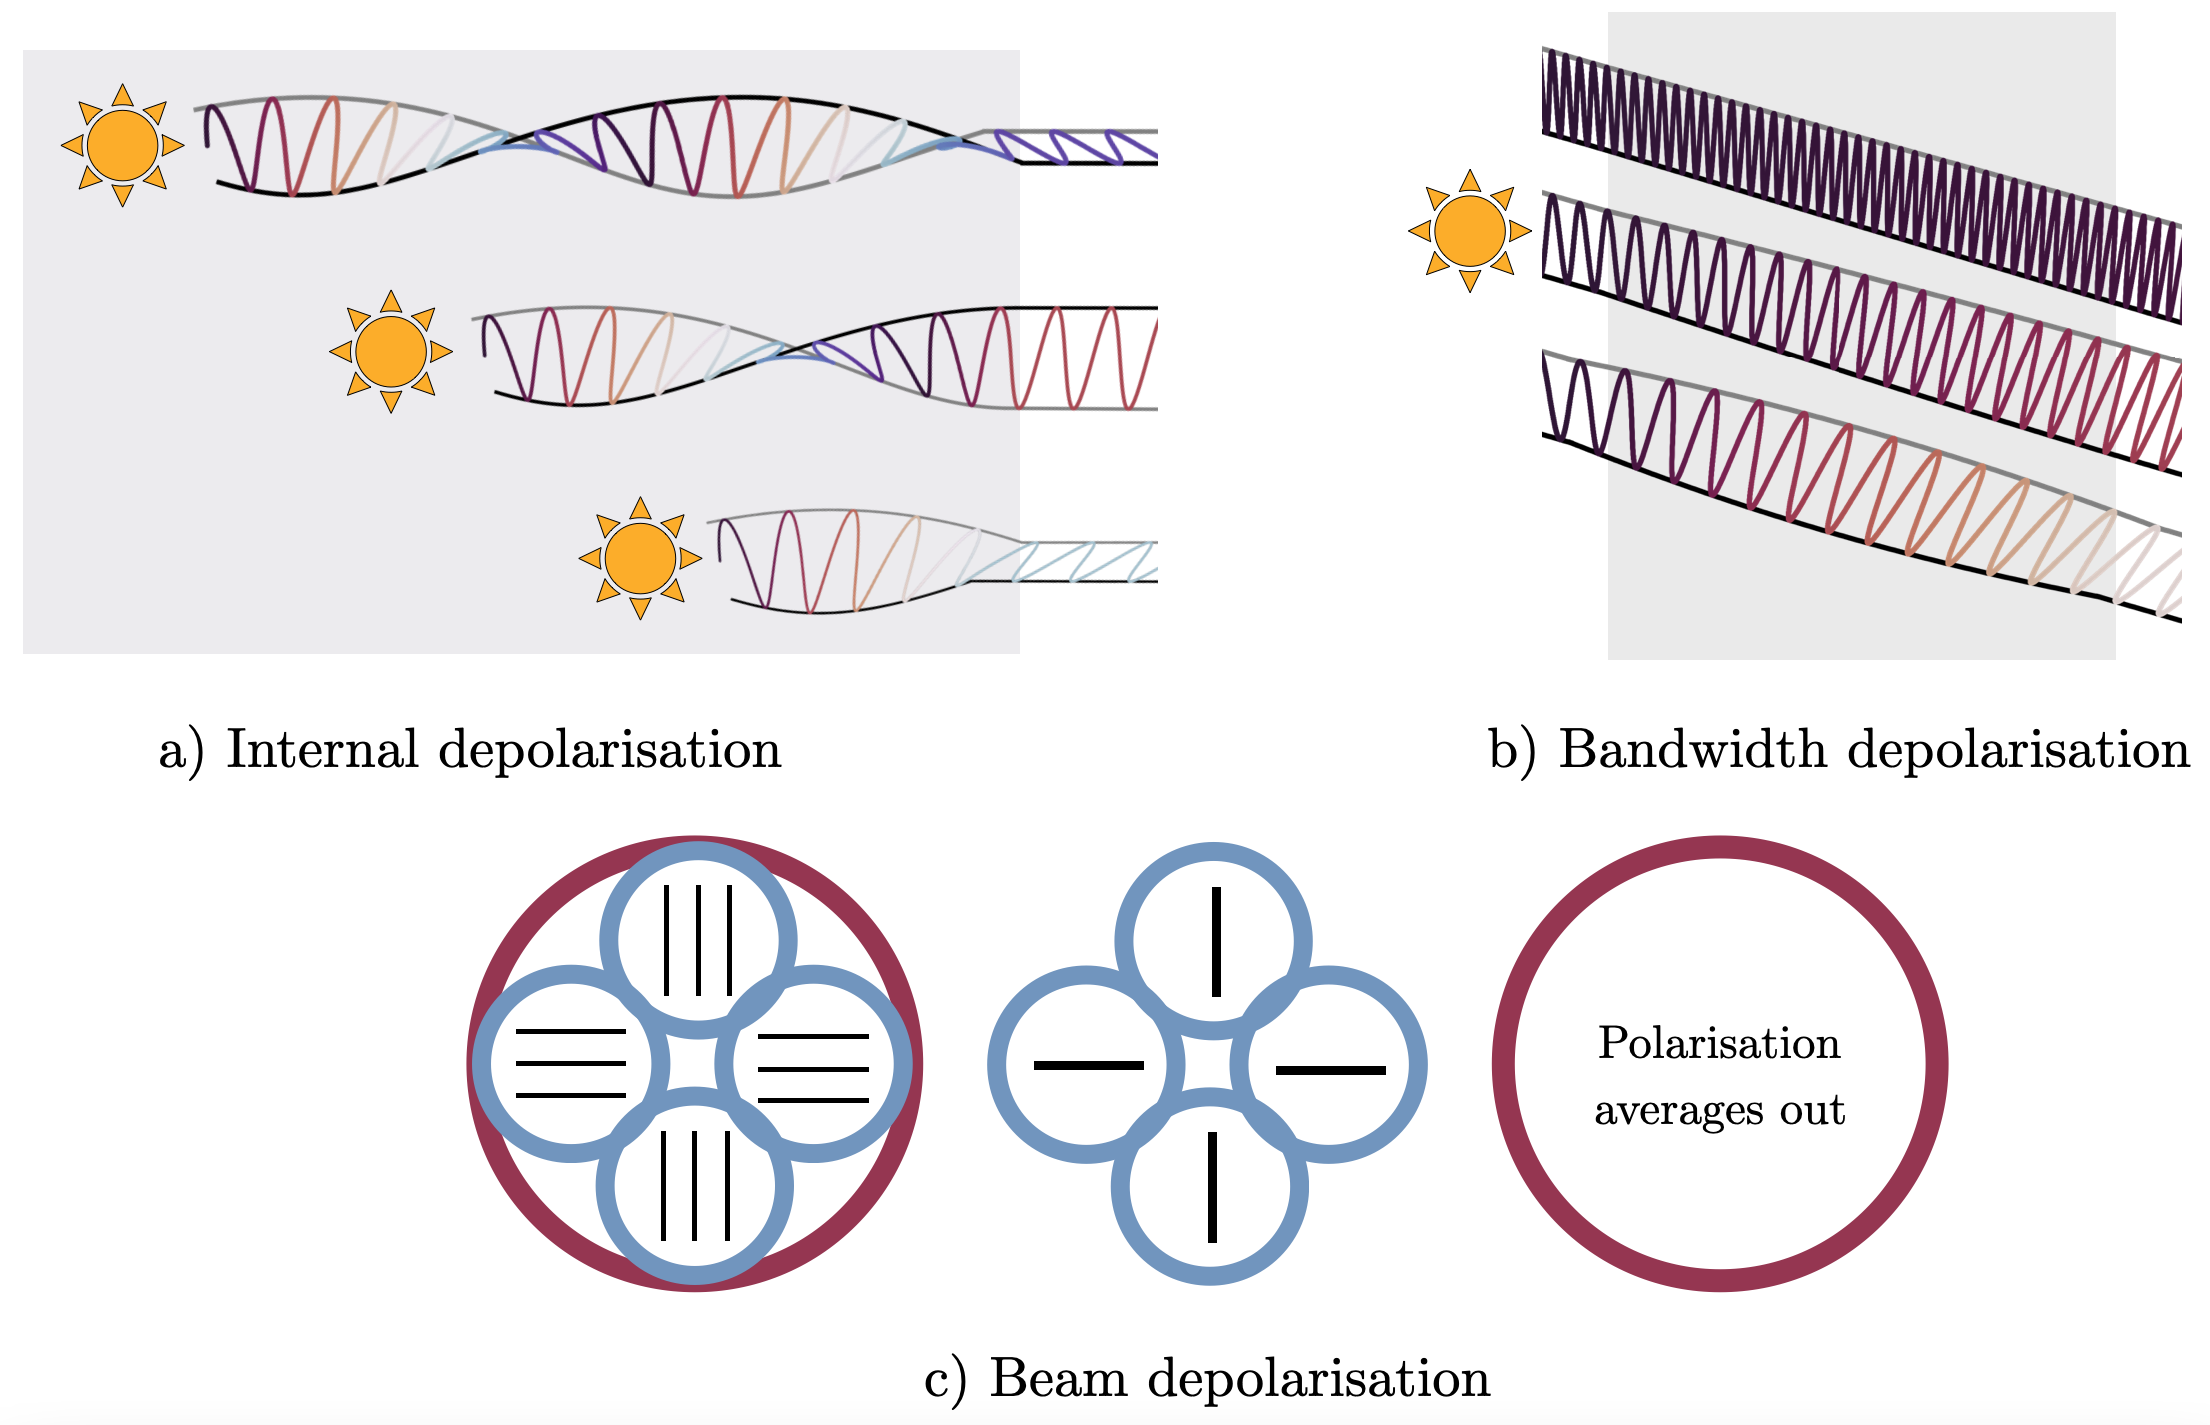
Depolarisation mechanisms. a) Internal depolarisation occurs due to the shaded Faraday-rotating medium also producing polarised synchrotron emission. Despite the emission originating at the same polarisation angles and experiencing the same rate of rotation, the difference in their path lengths results in them emerging from the medium with differing polarisation angles. b) Bandwidth depolarisation occurs due to insufficient sampling in frequency/ wavelength space. As rotation angle goes as λ2, too course a resolution means that a range of polarisation angles are observed across the band. c) Beam depolarisation occurs due to insufficient spatial sampling. Considering areas of different observed polarisation angle (arrows indicating this direction within the small circles), if they are not sampled individually then their individual polarisation angles are cancelled out. The code I wrote to generate the rotating waves can be found here. If used, please cite with the DOI 10.5281/zenodo.5899326.
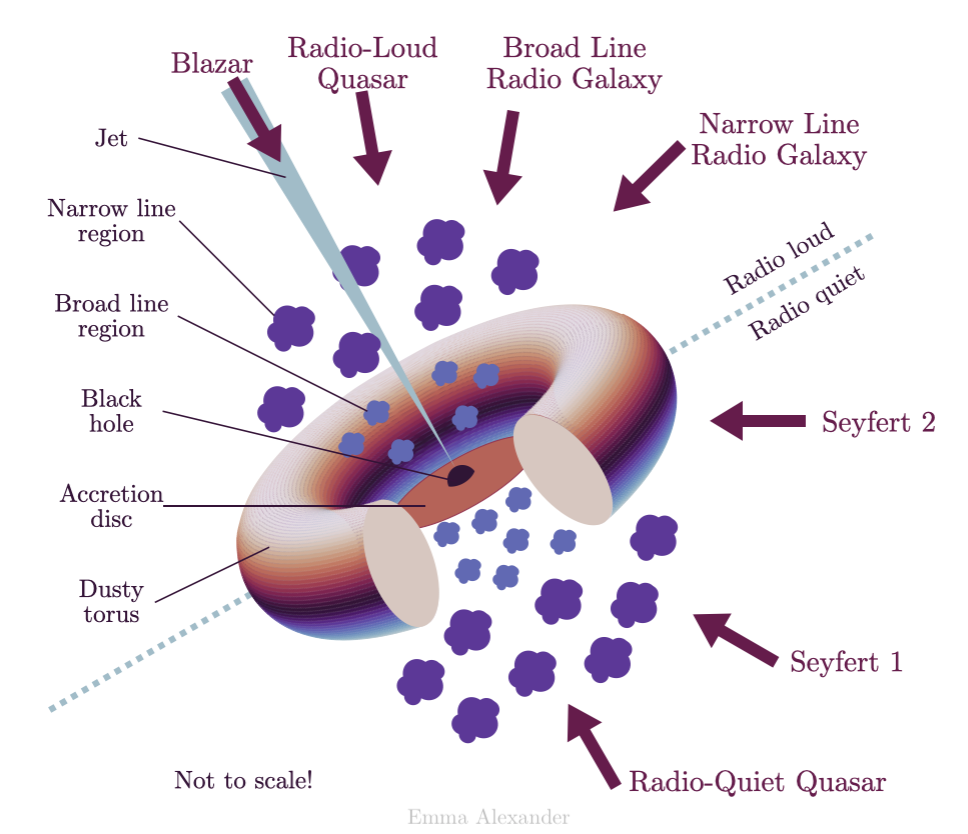
Unified model of AGN adapted from Urry & Padovani (1995). The thick arrows represent different viewing angles, and the observed object which results from them. Note the asymmetry of the diagram; this is to demonstrate the two different possibilities of radio loud/quiet and is not representative of a single object.
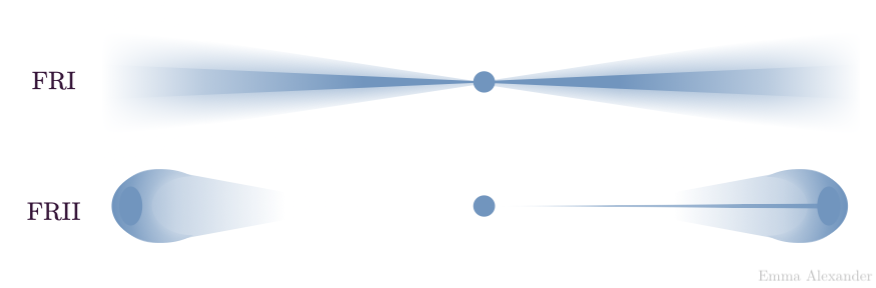
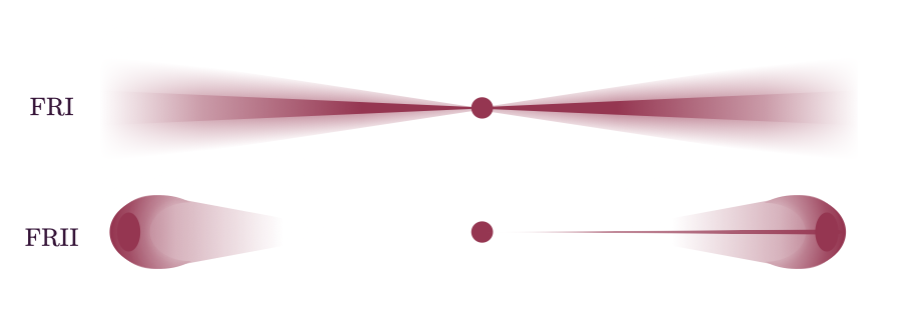
The traditional Fanaroff Riley classification of radio galaxies (Fanaroff & Riley, 1974). FRI galaxies are "centre-bright", and FRII galaxies are "edge-brightened" (often with "hotspots" towards the edge). In this diagram, the FRII is drawn with a visible jet on one side, typical of galaxies whose jets have some orientation towards the observer. However, an FRII may have visible jets on both sides or neither.